
Define the measurement
A price, a total-return series and a revenue figure answer different questions. Identify whether values include dividends, inflation adjustments or currency conversion. A chart can be mathematically correct yet misleading when its label hides these distinctions.
If you compare assets quoted in different currencies, either keep them separate or describe the conversion source and date. Changing a line’s color cannot make incompatible units comparable.
Use a common baseline when appropriate
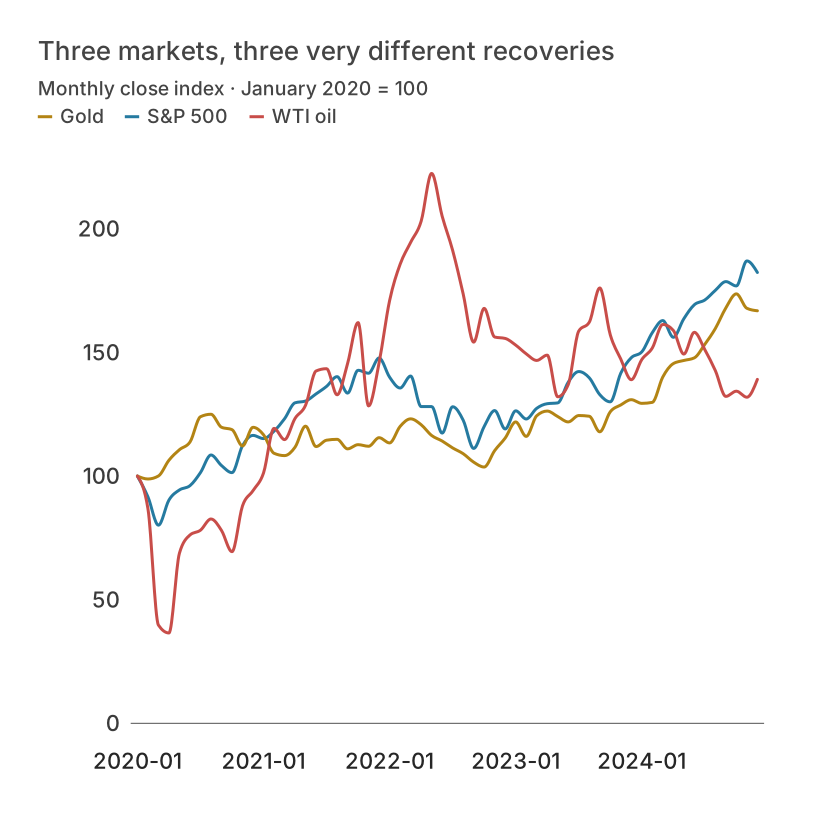
Indexing allows relative performance comparisons from a chosen date: divide each observed value by its baseline and multiply by 100. An asset rising from 50 to 60 and another rising from 200 to 220 have indexed endpoints of 120 and 110. The first increased more proportionally even though its absolute price remains lower.
The baseline changes the story. Label it and avoid selecting a convenient starting date without explanation. A zero or missing baseline cannot support division; use another valid date or report the limitation.
| Month | S&P 500 | Gold | WTI oil |
|---|---|---|---|
| 2020-01 | 100 | 100 | 100 |
| 2020-02 | 91.58895163615968 | 98.81230345958936 | 86.81147620123933 |
| 2020-03 | 80.12940773085735 | 100.03158759190651 | 39.72071178579395 |
| 2020-04 | 90.2933453832314 | 106.39964149317076 | 36.53995277499613 |
| 2020-05 | 94.38199236587486 | 110.66396640054994 | 68.83242966097211 |
| 2020-06 | 96.11752586527275 | 113.74691845535136 | 76.16369164432611 |
Keep gaps and sampling visible
Markets do not trade every day. Align comparable observations and distinguish non-trading days from missing records. Interpolating gaps creates values that were not quoted. Document any resampling or conversion to monthly closing values.
Dense lines can preserve peaks and troughs while reducing display points, but the underlying observations still matter for analysis. Do not calculate volatility or returns from a screenshot or a visually simplified path.
Avoid causal stories from coincidence
A drawdown chart can show distance from a prior peak; a return distribution can show variation; a scatter plot can explore co-movement. None of these alone establishes why a market moved. Annotation dates should describe events without claiming causality that the data cannot support.
In Datamon, check dates, units and the selected transformation, then add a source and baseline caption. Review exact values in a table and retain the original data for any subsequent calculation. This workflow describes visualization practice, not an investment recommendation.
What is free and what needs an account?
Reading this guide and downloading its CSV and chart images are free. Datamon currently has no paid checkout or subscription plans in this deployment. Creating and saving an editable visualization requires Google sign-in. Provider-backed AI, cloud analysis, publishing and video depend on configured services; this guide does not promise unlimited free connected services.
Sources and further reading
Report a correction or an access barrier: Email the editorial contact.
Open Datamon