
Start with a question
A CSV file is a table, not an analysis. Decide what you want to compare before choosing a chart: monthly revenue, response rates by district, or the relationship between price and demand. Identify the observation represented by each row and the units of every numeric column. A meaningful figure begins with those two decisions.
For monthly sales, use one row per month and one column per measure. Keep the currency and period explicit. A total row mixed with monthly records can double-count sales; place totals outside the observation table.
Check what the importer read
Open Data in Datamon and import the CSV or paste cells. Review the detected headers, column types, decimal separator and date order. A value such as 1,234 can mean a decimal or a thousands-separated number. Verify several known values against the source rather than accepting automatic detection blindly.
A blank cell represents an unknown value unless the source says otherwise. Zero represents a recorded measurement. Filling blanks with zero creates drops that were never observed. Keep gaps visible or describe an estimation method in the caption.
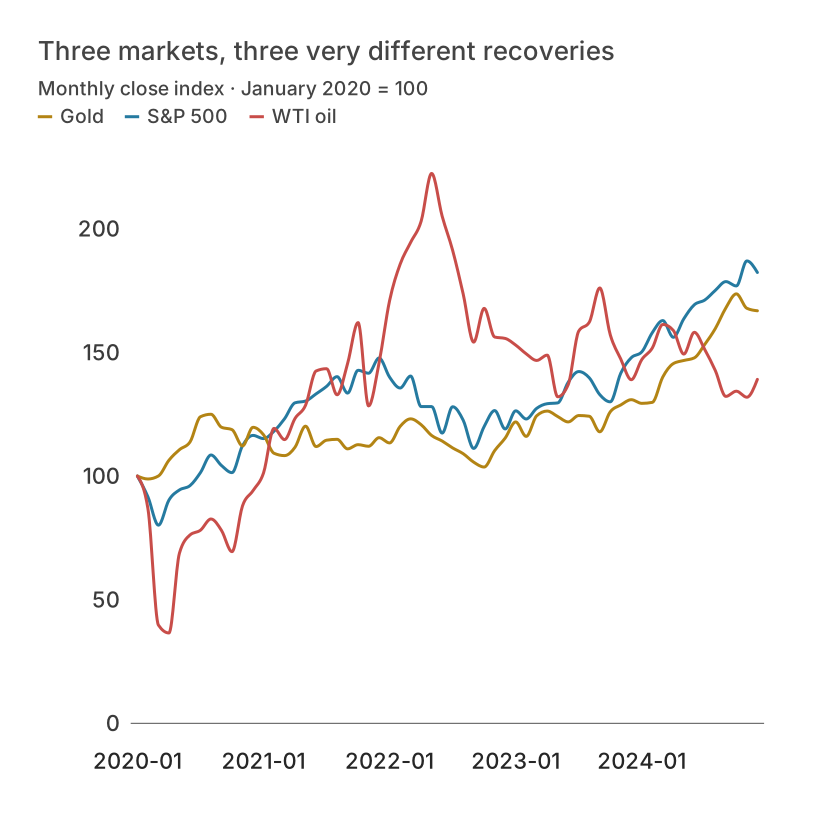
| Month | S&P 500 | Gold | WTI oil |
|---|---|---|---|
| 2020-01 | 100 | 100 | 100 |
| 2020-02 | 91.58895163615968 | 98.81230345958936 | 86.81147620123933 |
| 2020-03 | 80.12940773085735 | 100.03158759190651 | 39.72071178579395 |
| 2020-04 | 90.2933453832314 | 106.39964149317076 | 36.53995277499613 |
| 2020-05 | 94.38199236587486 | 110.66396640054994 | 68.83242966097211 |
| 2020-06 | 96.11752586527275 | 113.74691845535136 | 76.16369164432611 |
Map columns to the question
Choose a line for change over time, bars for named categories, or a scatter plot for pairs of numeric measures. Map the date or category to the horizontal dimension and the measure to the value dimension. Sort dates chronologically; alphabetic month sorting gives an incorrect trajectory.
If multiple rows describe the same month, decide whether to sum, average or keep separate records. Revenue often adds across transactions, while a satisfaction score usually does not. State the aggregation and sample count.
Make the figure verifiable
In Refine, add a title, units, source and period. Use direct labels or a short legend; avoid a palette that forces readers to guess which line is which. Inspect a small-screen view and compare several displayed values with the source.
Export a local figure or publish deliberately. A published chart includes its underlying values, so remove confidential fields before sharing. Save the original CSV and a project backup so you can repeat the work later.
What is free and what needs an account?
Reading this guide and downloading its CSV and chart images are free. Datamon currently has no paid checkout or subscription plans in this deployment. Creating and saving an editable visualization requires Google sign-in. Provider-backed AI, cloud analysis, publishing and video depend on configured services; this guide does not promise unlimited free connected services.
Sources and further reading
Report a correction or an access barrier: Email the editorial contact.
Open Datamon