

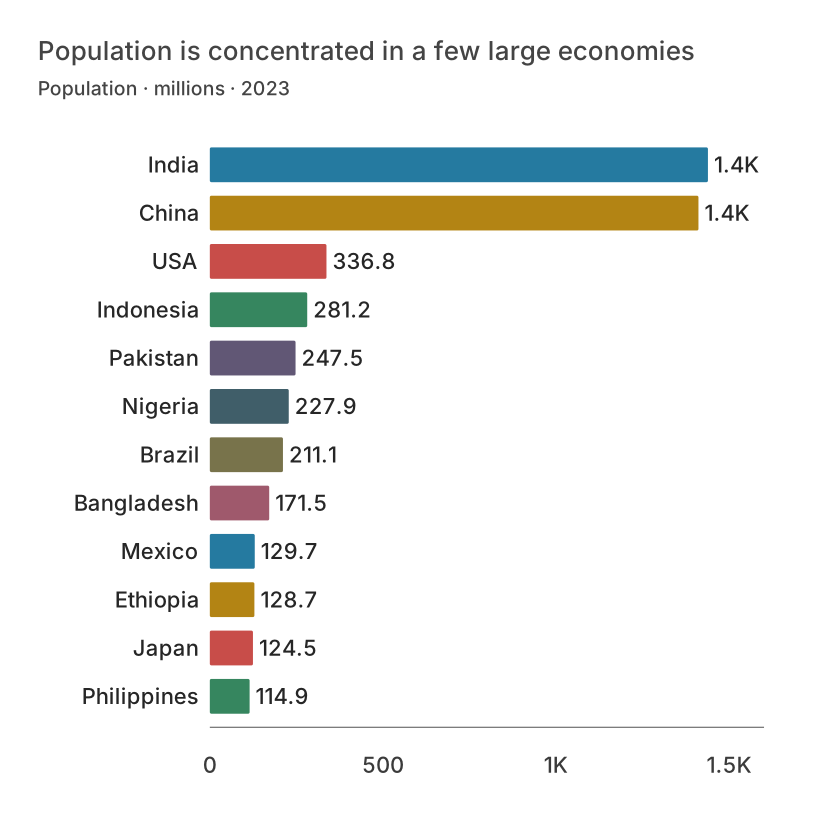
Bars compare discrete observations
Bars are a strong default for named categories such as departments, products or districts. Start the value axis at zero when length encodes magnitude; truncating it exaggerates differences. Horizontal bars make long labels easier to read and support a ranked list.
If sales are 98, 100 and 102 units, the differences are small relative to the total. A bar chart starting at 97 makes them look dramatic. If small differences are the task, use a dot plot with a clearly labelled scale rather than distorting bar lengths.
Lines describe ordered change
Connect observations when their order has meaning, commonly time. Sort dates and make interval spacing faithful to the calendar. A line implies continuity between observations; keep missing intervals visible rather than inventing measurements.
A line connecting North, South and West suggests a trajectory between categories that does not exist. Those categories belong in bars or dots unless their sequence has an analytical interpretation.
| Country | Population (m) |
|---|---|
| India | 1438.069596 |
| China | 1410.71 |
| USA | 336.755052 |
| Indonesia | 281.190067 |
| Pakistan | 247.504495 |
| Nigeria | 227.882945 |
Choose what comparisons deserve attention
Monthly totals can use columns if the task is comparing individual periods, or a line if the task is following direction over time. Neither choice is automatically correct. Consider the question and label the aggregation clearly.
With many series, a single plot becomes hard to trace. Highlight one series intentionally, use direct labels, or use separate views on a shared scale. Avoid adding lines simply because the dataset contains more columns.
Keep captions honest
Explain units, period, source and missing values. An index chart should show the baseline date and value. A log scale should be labelled and chosen for multiplicative comparisons, not to disguise volatility.
Before publishing, describe the main observation in a sentence and check whether the displayed chart actually supports it. A change in a series does not establish its cause.
What is free and what needs an account?
Reading this guide and downloading its CSV and chart images are free. Datamon currently has no paid checkout or subscription plans in this deployment. Creating and saving an editable visualization requires Google sign-in. Provider-backed AI, cloud analysis, publishing and video depend on configured services; this guide does not promise unlimited free connected services.
Sources and further reading
Report a correction or an access barrier: Email the editorial contact.
Open Datamon