
Name the task before the chart
Ask what the reader needs to learn. Comparing departments is different from tracing a monthly trend. Finding an unusual observation is different from showing a share of the total. Start with a sentence that names the decision, then choose an encoding that makes that comparison direct.
For category comparisons, position and length on a common scale support precise reading. A sorted bar chart often communicates a ranking more clearly than a circle divided into many slices.
Use time and distributions deliberately
Lines communicate ordered change. Use dates at consistent positions and preserve gaps when observations are missing. Do not connect unrelated categories just because there is space for a line.
For a distribution, use a histogram to show frequencies or a box plot to summarize location and spread. Bin width changes a histogram’s apparent shape; compare several reasonable widths and retain the unit and sample count. A mean alone can hide a skewed distribution.
| Country | Income (USD) | Life (years) | Population (m) | Region |
|---|---|---|---|---|
| UAE | 49850.6945082084 | 82.909 | 10.483751 | Asia |
| Argentina | 14261.8465667948 | 77.395 | 45.538401 | South America |
| Australia | 65058.3773146674 | 83.0512195121951 | 26.659922 | Oceania |
| Austria | 56579.504175468 | 81.7926829268293 | 9.131761 | Europe |
| Belgium | 55244.68145811 | 82.4 | 11.779946 | Europe |
| Bangladesh | 2551.01773827307 | 74.672 | 171.46699 | Asia |
Separate relationships from composition
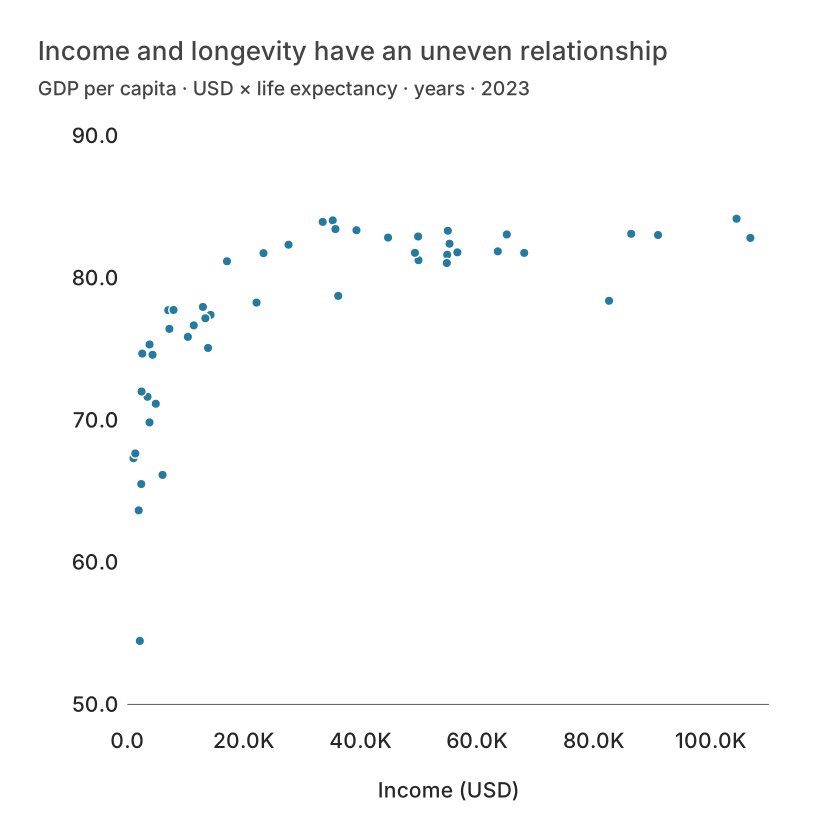
A scatter plot places one numeric variable on each axis. It helps reveal patterns, clusters and outliers but does not prove causation. Label variables and units, and inspect the population represented by each point.
For composition, use stacked bars when comparisons across groups matter. A pie or donut is useful for a small, exhaustive set of nonnegative shares of one total. Negative values, incomplete categories or a second overlapping denominator do not belong in a pie.
Use a map only when location matters
A map is useful when spatial relationships are part of the question. If the task is simply ranking regions, a bar chart can be more readable. Large regions dominate the page visually even when they contain few observations.
Use rates or normalized values for a choropleth when the intended comparison concerns relative prevalence. Keep raw counts available separately. Include the unit, classification method, period and a distinct no-data treatment.
What is free and what needs an account?
Reading this guide and downloading its CSV and chart images are free. Datamon currently has no paid checkout or subscription plans in this deployment. Creating and saving an editable visualization requires Google sign-in. Provider-backed AI, cloud analysis, publishing and video depend on configured services; this guide does not promise unlimited free connected services.
Sources and further reading
Report a correction or an access barrier: Email the editorial contact.
Open Datamon