
Prepare a plain observation table
A worksheet designed for printing is rarely ready for analysis. Remove merged headers, blank title rows and subtotals from the data range. Use one header row and one observation per row. Keep notes and formulas outside the region you intend to visualize.
For a regional comparison, a useful table has Region, Period, Population and Count columns. Preserve identifiers as text when leading zeros matter. A postal code is an identifier, not a numeric measure to average.
Inspect values rather than formatting
Import the workbook into Datamon’s Data stage, then inspect the selected sheet and detected fields. A cell formatted as a percentage may contain 0.25 rather than 25; label the unit consistently and check the numeric result. Do not infer currency solely from a formatted symbol.
Spreadsheet formulas may depend on external links, a calculation engine or stale cached values. Datamon is not a replacement for Excel’s formula recalculation. Confirm calculated results in the original workbook, and export a values-only table when the source needs recalculation.
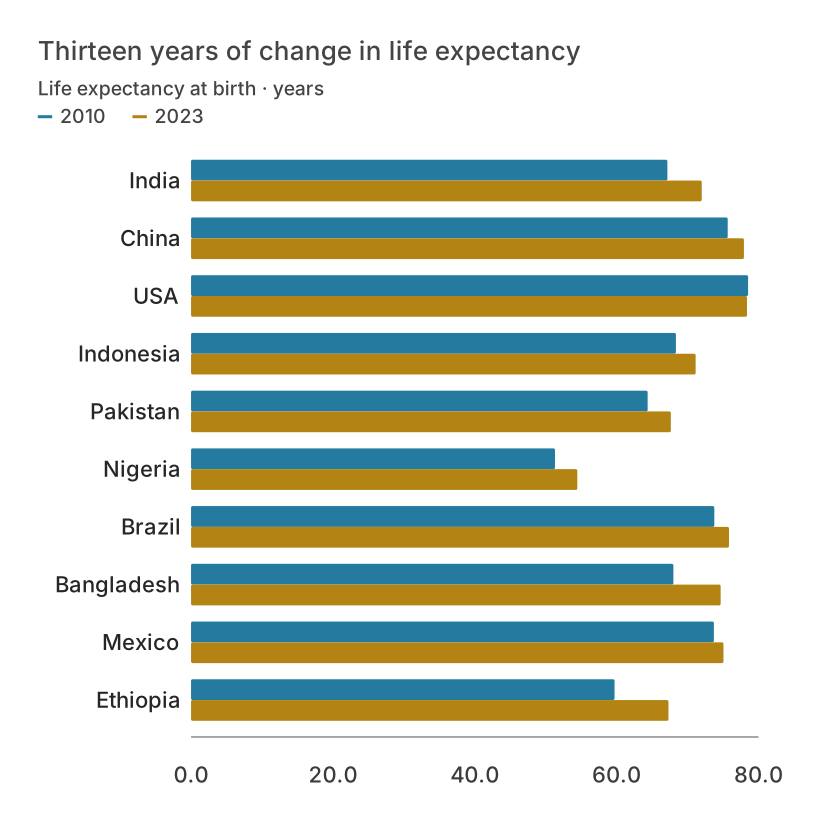
| Country | 2010 | 2023 |
|---|---|---|
| India | 67.162 | 72.003 |
| China | 75.668 | 77.953 |
| USA | 78.5414634146342 | 78.3853658536585 |
| Indonesia | 68.364 | 71.146 |
| Pakistan | 64.378 | 67.649 |
| Nigeria | 51.315 | 54.462 |
Choose the interaction that helps
Use a line chart for dated observations or bars for regional comparisons. A tooltip should answer a real question, such as the exact value and period. Interaction cannot compensate for a missing unit or misleading axis. Provide a readable default view that works before a reader moves the pointer.
For multiple series, keep comparable units on one scale. Mixing dollars and percentages on the same axis is meaningless. Use separate views or a clearly explained transformation such as an index with a common baseline.
Deliver both evidence and context
Use Refine to add a source, clear title and readable labels. Inspect the result at the size where it will be used. Export formats include SVG, PNG, JPEG, PDF and PowerPoint; a static export does not retain hover interactions.
Use a web publication for interactive sharing only when that deployment is configured. Share the source table or accessible summary alongside the chart when exact values matter. Retain an untouched original workbook.
What is free and what needs an account?
Reading this guide and downloading its CSV and chart images are free. Datamon currently has no paid checkout or subscription plans in this deployment. Creating and saving an editable visualization requires Google sign-in. Provider-backed AI, cloud analysis, publishing and video depend on configured services; this guide does not promise unlimited free connected services.
Sources and further reading
Report a correction or an access barrier: Email the editorial contact.
Open Datamon