
Design at the delivery size
A chart that looks readable on a large monitor may fail on a projector or inside a report column. Set the intended canvas size before polishing. Inspect labels at the final display size rather than judging a zoomed editor.
Give the figure one clear analytical task. Move secondary measures to another slide or an appendix. A short title can state the finding, while the description explains the unit and population.
Keep the information hierarchy simple
Use a restrained palette and consistent units. Show reference lines only when they help interpret the data. An annotation should point to a specific observation and explain why it matters; it should not restate a value already printed beside the mark.
Place the source and period where they remain visible after the figure is copied. If values are indexed, estimated or aggregated, keep that method in the caption. Do not remove uncertainty merely to simplify a slide.
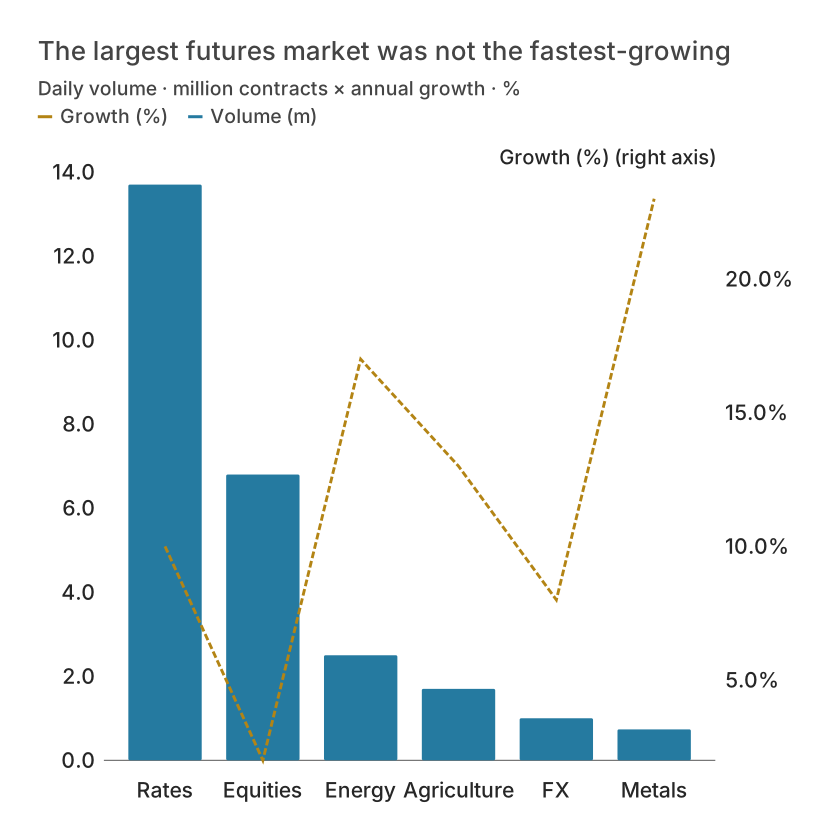
| Asset class | Volume (m) | Growth (%) |
|---|---|---|
| Rates | 13.7 | 10 |
| Equities | 6.8 | 2 |
| Energy | 2.5 | 17 |
| Agriculture | 1.7 | 13 |
| FX | 1 | 8 |
| Metals | 0.736 | 23 |
Choose a format for the destination
SVG preserves vector geometry and editable text when the destination supports it. PNG and JPEG are raster formats; export at sufficient resolution for the placement. PDF is useful for document delivery. PowerPoint export provides a slide-oriented output, but you should still inspect the result in the destination application.
Fonts, embedding and layout can vary between viewers. Check a representative long label and a dense legend after export. If a collaborator needs exact values, attach the table rather than relying on pixels.
Make a chart accessible without interaction
A static slide loses tooltips, legend toggling and other web interactions. Include a text summary and accessible data table in the report or speaker notes. Color alone should not be the only way to identify a series.
Keep a project backup and source file alongside the delivered figure. This is especially useful when a reader asks for a corrected date, a new annotation or a different unit later.
What is free and what needs an account?
Reading this guide and downloading its CSV and chart images are free. Datamon currently has no paid checkout or subscription plans in this deployment. Creating and saving an editable visualization requires Google sign-in. Provider-backed AI, cloud analysis, publishing and video depend on configured services; this guide does not promise unlimited free connected services.
Sources and further reading
Report a correction or an access barrier: Email the editorial contact.
Open Datamon