
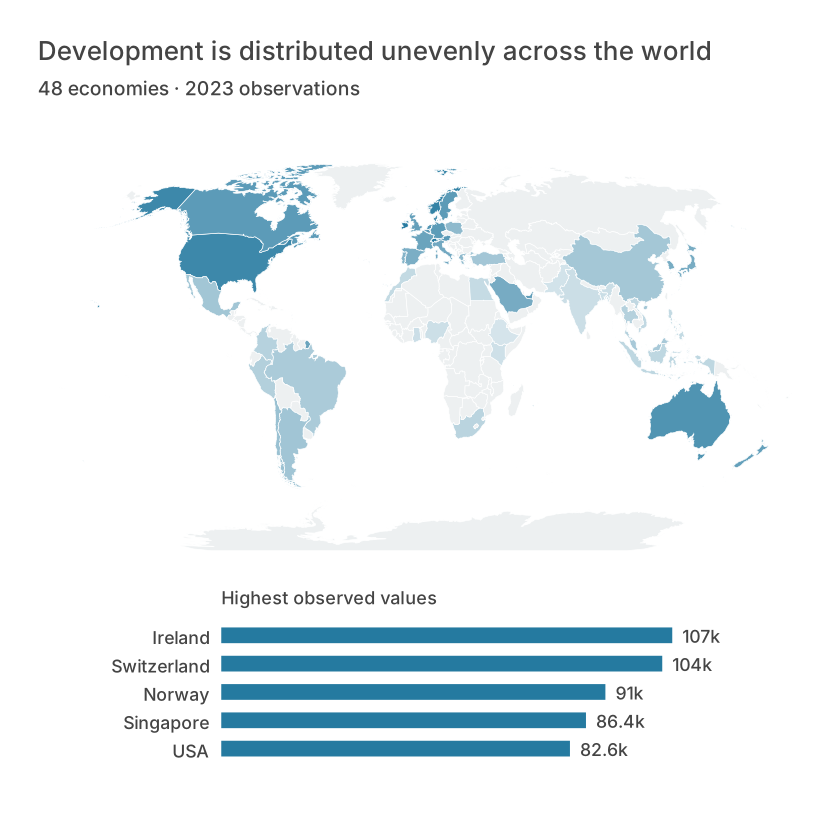
Begin with regions and one measure
A choropleth shades geographic regions using a value associated with each region. Prepare a table with an identifier, measure, unit and period. Choose the administrative level deliberately; a city and a province with similar names are not interchangeable.
Use consistent identifiers such as ISO country codes where the selected boundary set supports them. Review unmatched records and duplicate regions instead of silently dropping them. If several records map to one region, define an aggregation before joining.
Normalize the comparison
Raw counts often track population or area rather than the phenomenon you want to compare. For prevalence, use a rate with a stated denominator. A district with 200 cases among 100,000 residents has a lower rate than a district with 80 cases among 10,000 residents.
These rates are 200 and 800 per 100,000 respectively. Keep the raw counts and population available to readers. A rate without its denominator can be unstable in small populations.
| ISO3 | Income (USD) | Life (years) | Population (m) | Latitude | Longitude | Economy | Continent |
|---|---|---|---|---|---|---|---|
| ARE | 49850.6945082084 | 82.909 | 10.483751 | 23.90927859875184 | 54.2971454388171 | UAE | Asia |
| ARG | 14261.8465667948 | 77.395 | 45.538401 | -34.68519584440964 | -64.76354412795912 | Argentina | South America |
| AUS | 65058.3773146674 | 83.0512195121951 | 26.659922 | -25.764019827613637 | 134.30370851350128 | Australia | Oceania |
| AUT | 56579.504175468 | 81.7926829268293 | 9.131761 | 47.592333826435514 | 14.111392235962336 | Austria | Europe |
| BEL | 55244.68145811 | 82.4 | 11.779946 | 50.64016971234367 | 4.646175091955645 | Belgium | Europe |
| BGD | 2551.01773827307 | 74.672 | 171.46699 | 23.860318325578753 | 90.24720523537584 | Bangladesh | Asia |
Explain classification
The same values can look different under equal intervals, quantiles or custom thresholds. Choose a method tied to the question and show it in the legend or caption. Do not choose boundaries merely to create a dramatic visual contrast.
Use a sequential palette for increasing values and a diverging palette only when a meaningful midpoint exists. A missing observation must have its own treatment rather than inheriting the lowest color.
Check what the map cannot show
Large regions dominate visually, while small regions can disappear at the chosen scale. Provide a table or ranked chart for exact comparisons. A national average does not describe every person or neighborhood within that region.
In Datamon, choose the map type and geography, map the regional field and value, then inspect matches and the legend. Add source, period, normalization and classification before export or public sharing.
What is free and what needs an account?
Reading this guide and downloading its CSV and chart images are free. Datamon currently has no paid checkout or subscription plans in this deployment. Creating and saving an editable visualization requires Google sign-in. Provider-backed AI, cloud analysis, publishing and video depend on configured services; this guide does not promise unlimited free connected services.
Sources and further reading
Report a correction or an access barrier: Email the editorial contact.
Open Datamon