
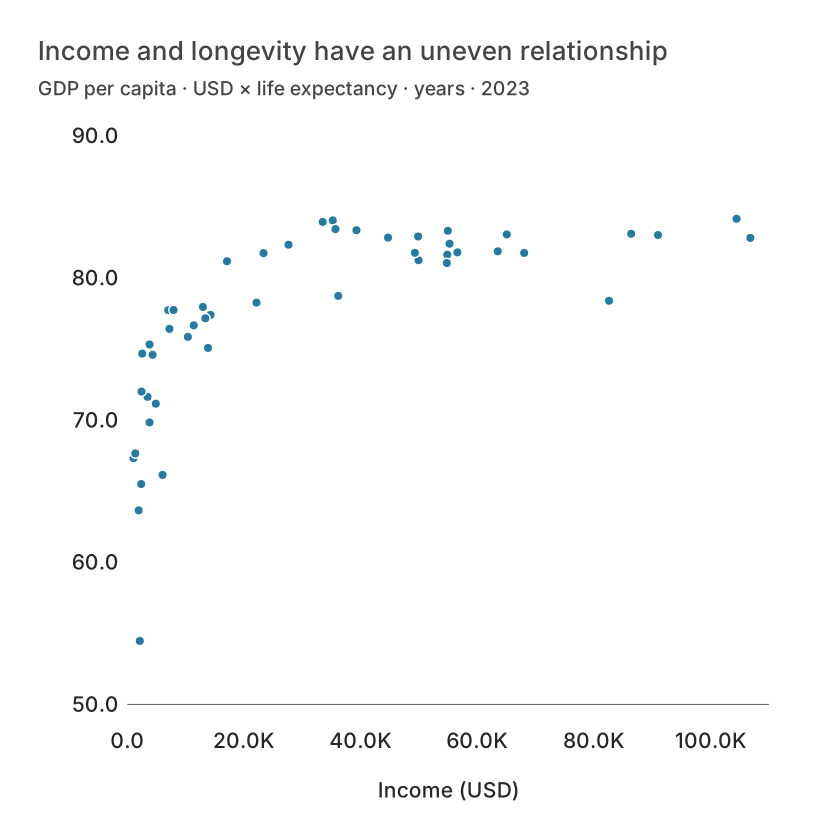
Split calculation from interpretation
AI is useful for suggesting a view, describing a pattern or proposing a next question. It should not be the sole authority for numeric totals, growth rates or statistical results. Calculate those deterministically, then use the result as evidence for an explanation.
For example, a revenue series rising from 100 to 121 over two years has a compound annual growth rate of 10%, not 21% per year. Check the start, end and elapsed period before asking an assistant to describe the growth.
Give the question a boundary
Specify the measure, unit, period and population. Ask for a proposed chart or an explanation tied to visible evidence. An instruction such as “find an insight” is underspecified and can encourage a plausible story with little support.
Ask the assistant to separate observations from hypotheses. Correlation between ad spending and revenue is an observation; attributing the revenue increase to advertising requires a causal design or additional evidence.
| Country | Income (USD) | Life (years) | Population (m) | Region |
|---|---|---|---|---|
| UAE | 49850.6945082084 | 82.909 | 10.483751 | Asia |
| Argentina | 14261.8465667948 | 77.395 | 45.538401 | South America |
| Australia | 65058.3773146674 | 83.0512195121951 | 26.659922 | Oceania |
| Austria | 56579.504175468 | 81.7926829268293 | 9.131761 | Europe |
| Belgium | 55244.68145811 | 82.4 | 11.779946 | Europe |
| Bangladesh | 2551.01773827307 | 74.672 | 171.46699 | Asia |
Review data leaving the browser
In Datamon, supported local calculations are separate from configured AI requests. AI requests send a data profile, sample values and rows, the prompt and relevant context to the server and provider. Do not assume a sample is anonymous: a single row can include identifying information.
Remove confidential fields and inspect the sample before using connected AI. Check provider retention and your organization’s rules. An automated field-name filter does not reliably detect all personal information.
Verify the proposed action
Datamon validates structured chart actions rather than running arbitrary generated JavaScript or SQL. Review the recommendation and proposed changes before applying them. A valid action can still select the wrong chart or create a misleading emphasis.
Compare the result with the original data and preserve your source. Use local calculators for reproducible calculations, and treat narrative explanations as drafts that require review.
What is free and what needs an account?
Reading this guide and downloading its CSV and chart images are free. Datamon currently has no paid checkout or subscription plans in this deployment. Creating and saving an editable visualization requires Google sign-in. Provider-backed AI, cloud analysis, publishing and video depend on configured services; this guide does not promise unlimited free connected services.
Sources and further reading
Report a correction or an access barrier: Email the editorial contact.
Open Datamon