
What this helps you see
Highlight the series a report discusses while keeping comparison series readable. Datamon supports individual series settings rather than requiring a new chart for every visual treatment.
Free example data and exact column mapping
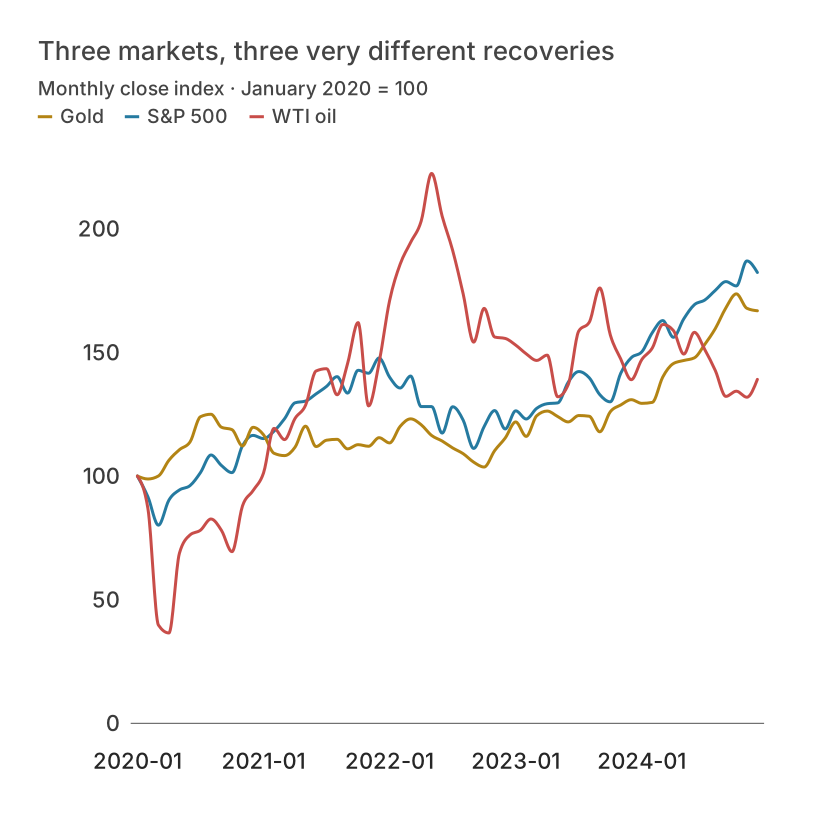
The figure uses the downloadable CSV with the exact column mapping below. Public snapshots retain their data notes and transformations. Constructed teaching scenarios are identified in the method notes; they are not customer results. Editorial layouts may combine comparisons from the same records.
The free example contains 60 observations and these columns: Month, S&P 500, Gold, WTI oil. Keep the header row and preserve one observation per row. The table below shows the first records; the CSV retains the full example.
| Month | S&P 500 | Gold | WTI oil |
|---|---|---|---|
| 2020-01 | 100 | 100 | 100 |
| 2020-02 | 91.58895163615968 | 98.81230345958936 | 86.81147620123933 |
| 2020-03 | 80.12940773085735 | 100.03158759190651 | 39.72071178579395 |
| 2020-04 | 90.2933453832314 | 106.39964149317076 | 36.53995277499613 |
| 2020-05 | 94.38199236587486 | 110.66396640054994 | 68.83242966097211 |
| 2020-06 | 96.11752586527275 | 113.74691845535136 | 76.16369164432611 |
How to use it in Datamon
- Open Refine and select the intended series through the chart or series controls.
- Set its color, stroke or available mark settings. Use line fill controls only for chart types that support them.
- Review visibility and highlighting so hidden comparison data does not silently change the story.
- Check the legend, direct labels and final export size after styling. Save a project backup before reusing the style.
Column mapping
- Categories / X axis
- Month
- Values / Y axis
- S&P 500, Gold, WTI oil
How to read the example
Compare positions and values with the table, then inspect the legend or size encoding where used. A visual pattern is a description of the displayed observations. It does not by itself identify a cause, justify extrapolation, or repair missing data.
Limits and common mistakes
Not every renderer supports every mark setting. A theme change and an explicit series override are separate choices; inspect existing custom styling before resetting it.
What is free and what needs an account?
Reading this guide and downloading its CSV and chart images are free. Datamon currently has no paid checkout or subscription plans in this deployment. Creating and saving an editable visualization requires Google sign-in. Provider-backed AI, cloud analysis, publishing and video depend on configured services; this guide does not promise unlimited free connected services.
Questions before you start
Can I visualize style individual chart series with a free example?
Yes. The CSV and preview images on this page are free to download. Follow the field mapping and steps above. Sign in to create and save the editable project; connected-service availability is separate.
Can I replace the example with my own data?
Yes. Preserve the observation unit and the required numeric, category or geographic fields. Recompute any derived values, update the unit and source, and compare the output with known rows before sharing.
Sources and further reading
Report a correction or an access barrier: Email the editorial contact.
Open Datamon