
The direct answer
Publish the aggregated daily table when the story concerns daily counts. Include the catalog query, magnitude threshold, time zone and source date. A public chart should contain only the columns needed to support the reader’s comparison.
Prepare the observation table
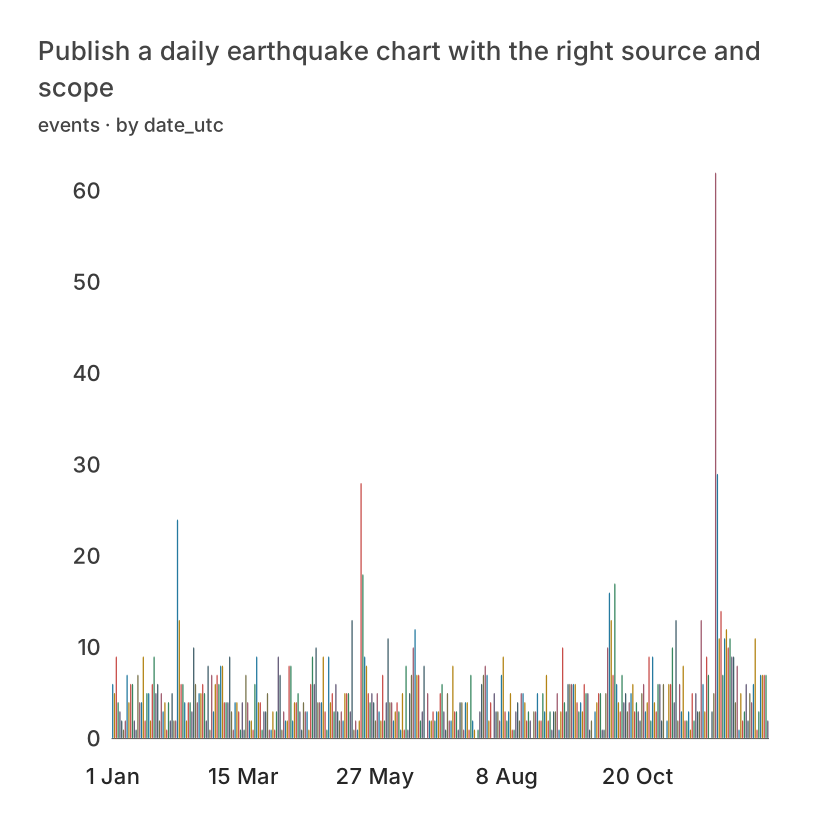
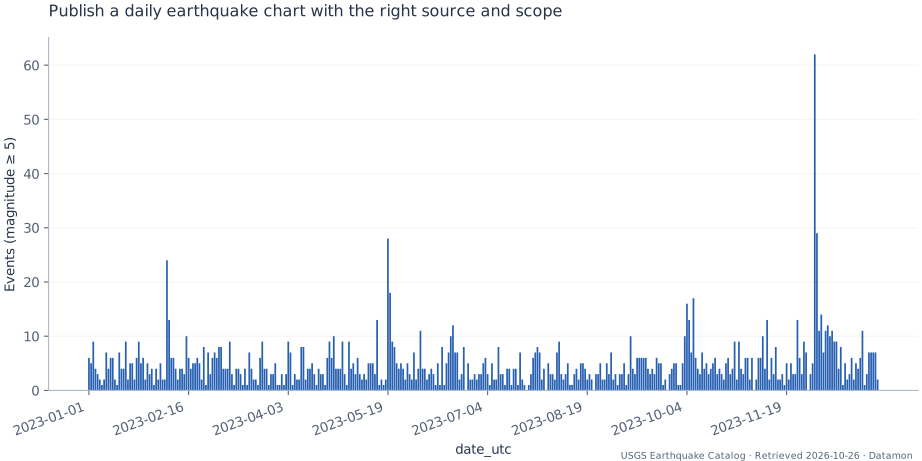
Use the 2023 UTC daily counts, verify that their sum matches the event table, and keep date_utc plus events. Add the USGS source and “magnitude ≥ 5” to the chart. Review the preview, then use Publish only when the underlying values are suitable for public access.
Public dataset and a reproducible example
The download is a prepared extract, not a live data connection. The source links below include the original query, observation period and reuse policy. Keep an original copy when you update the data; revised source values can change the result.
USGS Earthquake Catalog, worldwide earthquake events with magnitude ≥ 5, from 2023-01-01T00:00:00Z up to but excluding 2024-01-01T00:00:00Z. Later catalog revisions can alter values. This is an educational extract, not a risk or warning service.
Snapshot retrieved: 2026-10-26. Prepared rows: 365.
Download the prepared CSVDownload the reference SVG
| date_utc | events |
|---|---|
| 2023-01-01 | 6 |
| 2023-01-02 | 5 |
| 2023-01-03 | 9 |
| 2023-01-04 | 4 |
| 2023-01-05 | 3 |
Build it in Datamon
Sign in with Google to create an editable visualization. Public articles and examples can be read without an account. The prepared CSV already contains the joins, filters or aggregations described above; do those steps in a spreadsheet first when using your own data.
- Open Data and choose a file, or paste the table with its header row. Check the detected numeric columns, decimal separator and dates. The current importer accepts files below 20 MB; these examples are smaller. Keep blanks distinct from recorded zeros.
- In Visualize, select Column chart. Connect the roles exactly as listed below. Review the preview against at least two rows in the example table rather than relying only on automatic mapping.
- In Refine, add a title that states the question, the unit, observation period and source. Check labels and contrast at the size your reader will see. Keep a table when exact values matter.
- Use the export controls for SVG, PNG, PDF or PowerPoint, then inspect the actual file. Save an editable project backup. Publish only after checking the underlying values: a public link makes the published data available to anyone possessing the URL.
Calculation and column mapping
The rule below is pseudocode. The downloadable CSV already contains the prepared values; spreadsheet functions and cell references depend on your sheet layout.
SUM(events) must equal filtered catalog event count; publish only the two aggregate fields- X
- date_utc
- Y
- events
Read the result
In this extract, events ranges from 0 (2023-06-24) to 62 (2023-12-02).
Use the preview to check the structure and the CSV to check exact values. Its styling is a reference; your Datamon rendering can look different. Follow the mapping and preparation above to reproduce the analytical meaning.
Mistakes that change the meaning
Datamon public links expose the published visualization and underlying values to anyone who has the URL. An unlisted link is not confidential storage. Do not add internal annotations, personal data or private source columns to a project intended for publication.
Questions before sharing
Do these calculations require an AI service?
No. The prepared CSV and reference calculation are deterministic. Optional AI can help draft an explanation when configured, but it does not replace checking source values or choosing a valid comparison.
Can I use this example with my own spreadsheet?
Yes. Keep the same observation unit, column types and calculation. Replace the source attribution and time period, recompute derived columns, then compare several output values with your original sheet before sharing.
What is free and what needs an account?
Reading this guide and downloading its CSV and chart images are free. Datamon currently has no paid checkout or subscription plans in this deployment. Creating and saving an editable visualization requires Google sign-in. Provider-backed AI, cloud analysis, publishing and video depend on configured services; this guide does not promise unlimited free connected services.
Sources and further reading
Report a correction or an access barrier: Email the editorial contact.
Open Datamon